Free Windows beta for iRacing drivers→
PolarLap3D lap comparison

See where you lose time.
Instantly, in 3D.

Load your iRacing telemetry (the IBT file iRacing saves when you turn on recording with Alt+L), and your car races a reference car on real terrain. You see at a glance where the seconds went.

Windows 10 & 11 · private beta, invited testers only for now · some advanced features planned as paid in the full release

PolarLap · 3D lap comparisonYour lapReference lap
Biggest loss
+0.412s
Turn 3 entry
Plain-language coaching
You braked a little early. Try braking one marker later.
Free during beta
Every feature, no limits
Runs on your PC
Reads your IBT files locally
Garage 61 laps welcome
Just drop in the CSV
Auto-updates
New versions install themselves
Features

Can't read telemetry graphs? You'll still see where you're slow.

See the gap in 3D, then fix your biggest loss first, one corner at a time.

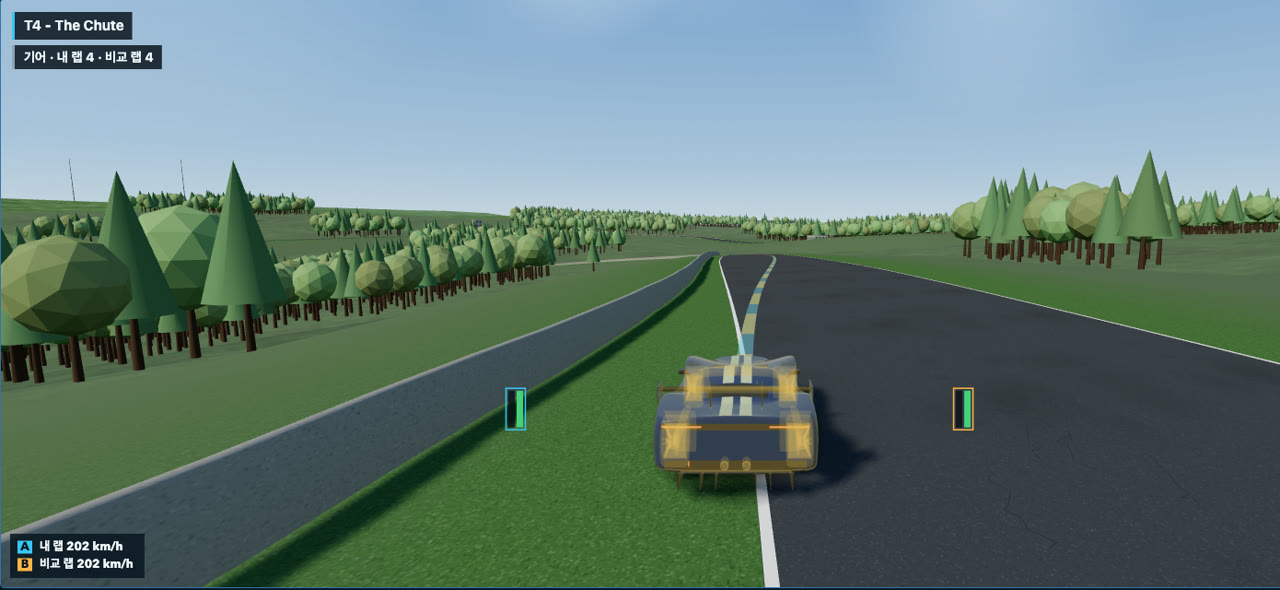
3D chase view

Overlay, time gap and gap view: three ways to watch

The same moment shown three ways, side by side, with both cars on a 3D track built from real terrain.

OverlayBoth cars at the same point: compare lines and inputs
Time gapSame start. Here the reference car is really about 50 m ahead
Gap viewThe same 50 m pulled in to about 30 m, so it stays in view

Time-loss ranking

One thing to fix first

Corners are ranked by the time you lost. Tap one to replay just that corner.

1Turn 3 +0.412s
2Turn 10 +0.268s
3Turn 1 +0.155s
Tap Turn 3 to see
+12 m
braked too early
−6 km/h
slowest speed
+0.08 s
late on the throttle
Plain-language coaching

It tells you what to change

Where the line turns red is where you braked. Instead of numbers, you get one thing to try on your next lap.

PolarBear Works mascot Ggongchi pointing at a floating 3D corner
“You braked a little early into Turn 3. Next lap, try braking one marker later.”
Telemetry at the same spot

Then see why you were slower

The 3D view and the graphs move together. Speed, brake and throttle for both laps, lined up at the exact same point on track.

Real-terrain 3D

Drive the real elevation of every circuit

We stack public elevation and map data into each circuit: hills and drops, corner names, woods and buildings, all loaded right inside PolarLap. You can see why you slow on the climb and why braking downhill is hard.

1
Ground elevationHeight from public terrain data, every 6 to 30 m
2
Track shape and corner namesRoad outline and corner names from OpenStreetMap
3
Woods, grass and buildingsSurroundings from public aerial imagery and ESA WorldCover
4
Your driving dataPosition, speed and pedals of both laps laid on top
298track layouts on real terrain
100%drawn on your PC, even offline
0 MBextra map downloads
PolarLap · real-terrain 3D
PolarLap 3D view of a car on a circuit with real elevation
Always improving
  • Finer elevation, down to kerbs and bumps
  • More lifelike trackside scenery
  • New tracks and layouts added over time
  • Prioritized by driver feedback
How it works

Three steps and you’re racing

Install, add two laps, and the comparison starts right away.

1

Add your lap

Hit “Open my last lap” to load the lap you just drove, or pick any lap from your IBT files.

2

Pick a lap to compare

Compare with your theoretical best (your best sectors stitched together), a slightly faster PolarLap driver or the top lap in the same conditions (coming soon), or a CSV from Garage 61.

3

Review corner by corner

Replay your biggest losses in 3D, then check the graphs to see why.

Coming soon

Get faster together with other PolarLap drivers

As drivers choose to share their own laps, we plan to recommend a lap just a bit faster than yours in the same conditions, and show per-track rankings.

Laps matched to you

A slightly faster lap and the top lap for the same track, car and weather.

Per-track rankings

Only verified laps make the leaderboard.

Driver tiers

BronzeSilverGoldPlatinumPro

See where you stand on each track and which tier to aim for next.

Fix one corner before your next session

Free beta for Windows PC · updates automatically